The Insights area in the sidebar gives you dashboards and reports for inventory health, activity, usage, and (when enabled) financial data. Every role can view these; only editors and admins can change inventory. Below is an overview of each page so you know where to look.
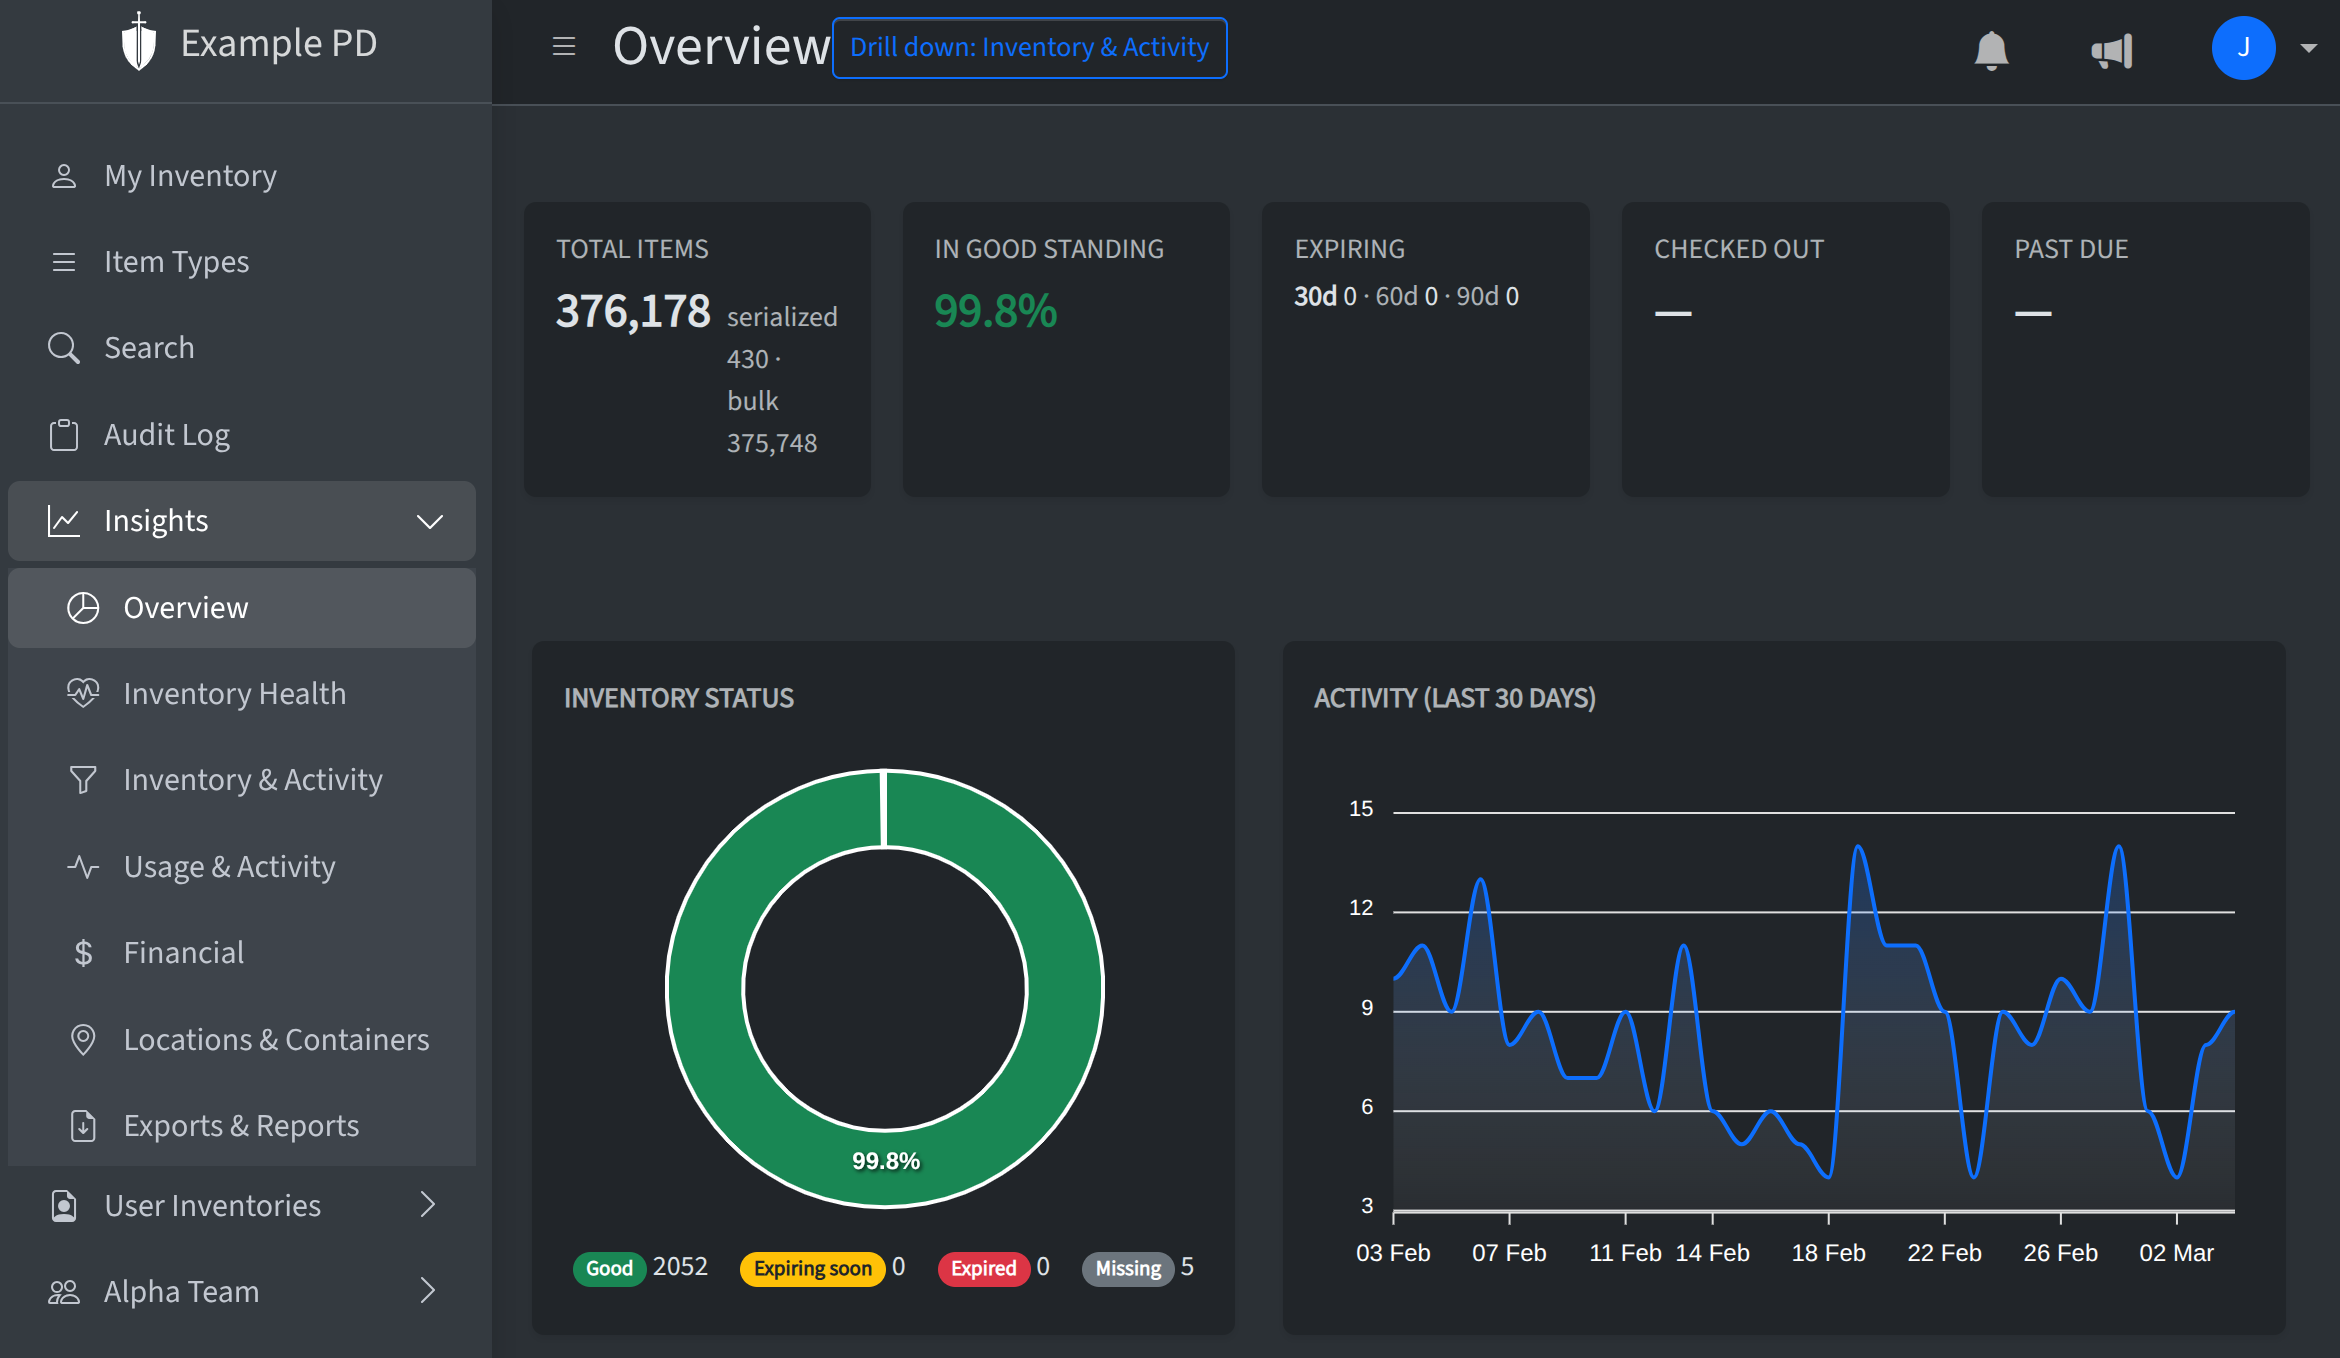
Overview
The Overview page is a high-level summary of your account: key counts (item types, locations, inventory), recent activity, and trends. You’ll see charts for audit activity over time and a snapshot of low-stock and expiration highlights. Use it to get a quick read on how things are doing.
Inventory health
Inventory health focuses on low stock and expirations account-wide. Batch items that are at or below their low-stock threshold or approaching or past expiration appear here so you can reorder or rotate stock.
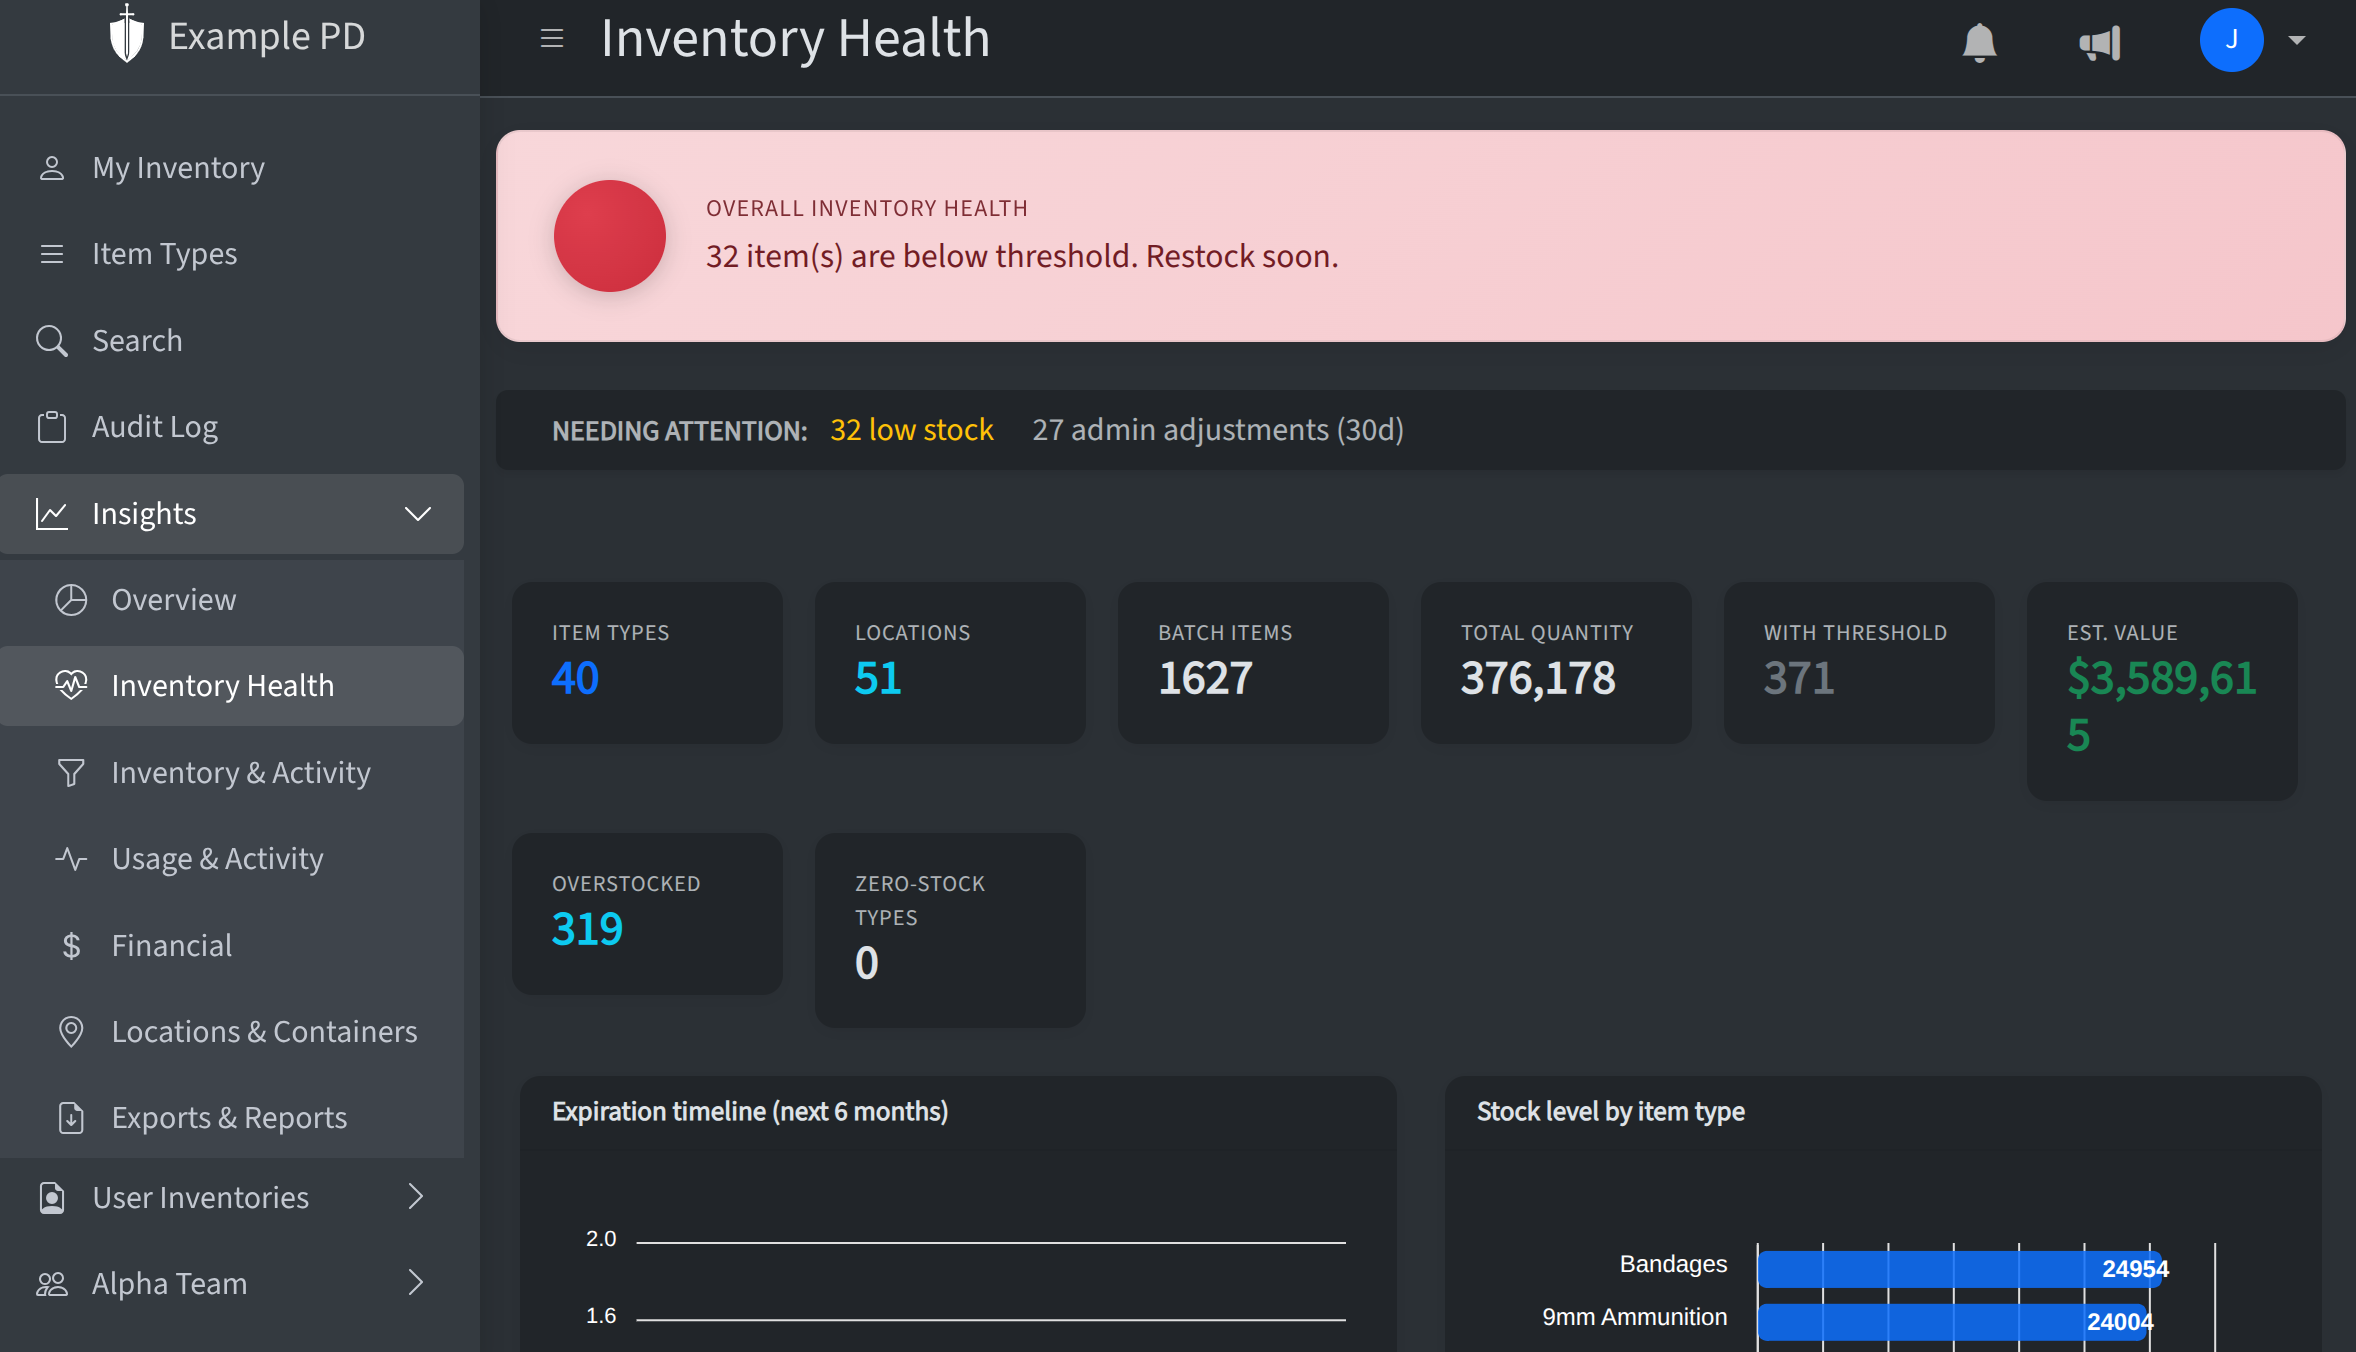
Use Export (CSV or Excel) on this page to download summary metrics, full low-stock / expired / expiring-soon lists, stock by item type, and a six-month expiration timeline—useful for archiving or sharing outside the app. CSV combines the same sections in one file with labeled blocks.
This page also includes a section for overdue inspections (based on your account’s days between inspections setting). For the full inspection workflow, see Inspections.
Inspections
Insights → Inspections lists locations with recent inspection history. Use Details on an inspection to open a summary and audit log activity for that location during the inspection window. See Inspections for starting and completing inspections from inventory.
Inventory & Activity
This page shows recent inventory-related activity and trends: audit events over time, top locations by movement, and most active users. You can filter by team, location, or item type to see activity for a specific slice of your data. Helpful for understanding where stock is moving and who’s making changes.
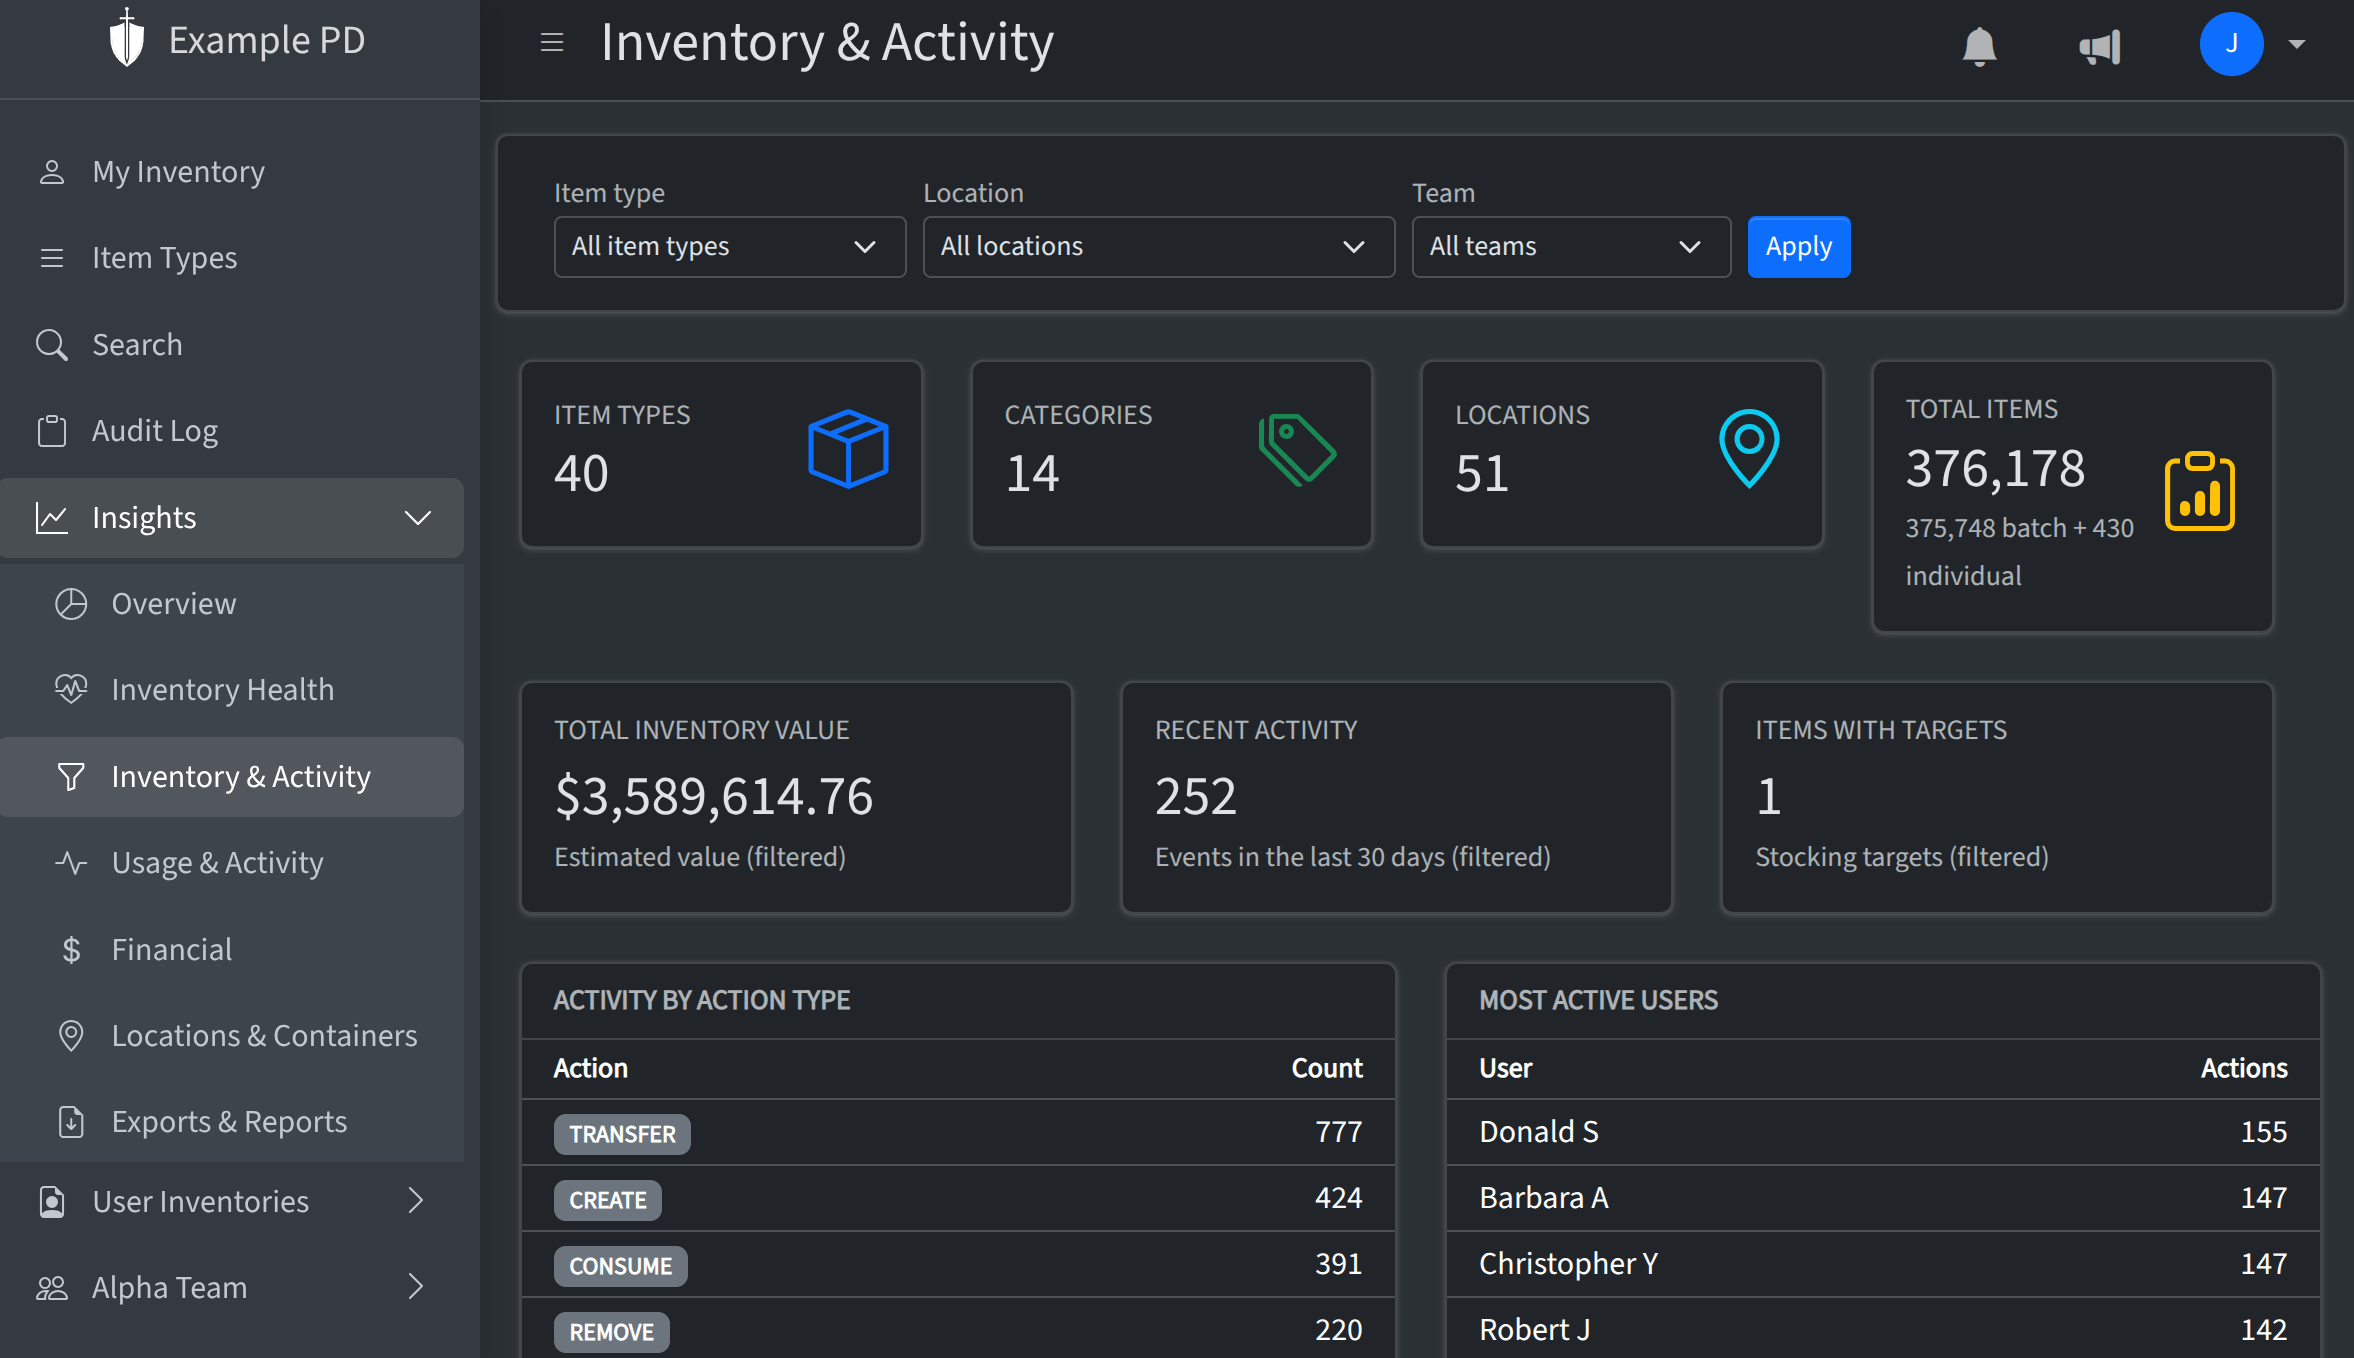
Download Excel saves a spreadsheet that matches your current filters (item type, location, team), including summary counts, activity by action, top locations, most active users, recent daily activity, and monthly audit totals.
Usage & Activity
Usage & Activity highlights consumption and transfers over a recent period. You’ll see usage by item type, transfer and consume counts, and events over time. Use it to see what’s being used and where, and to spot usage patterns.
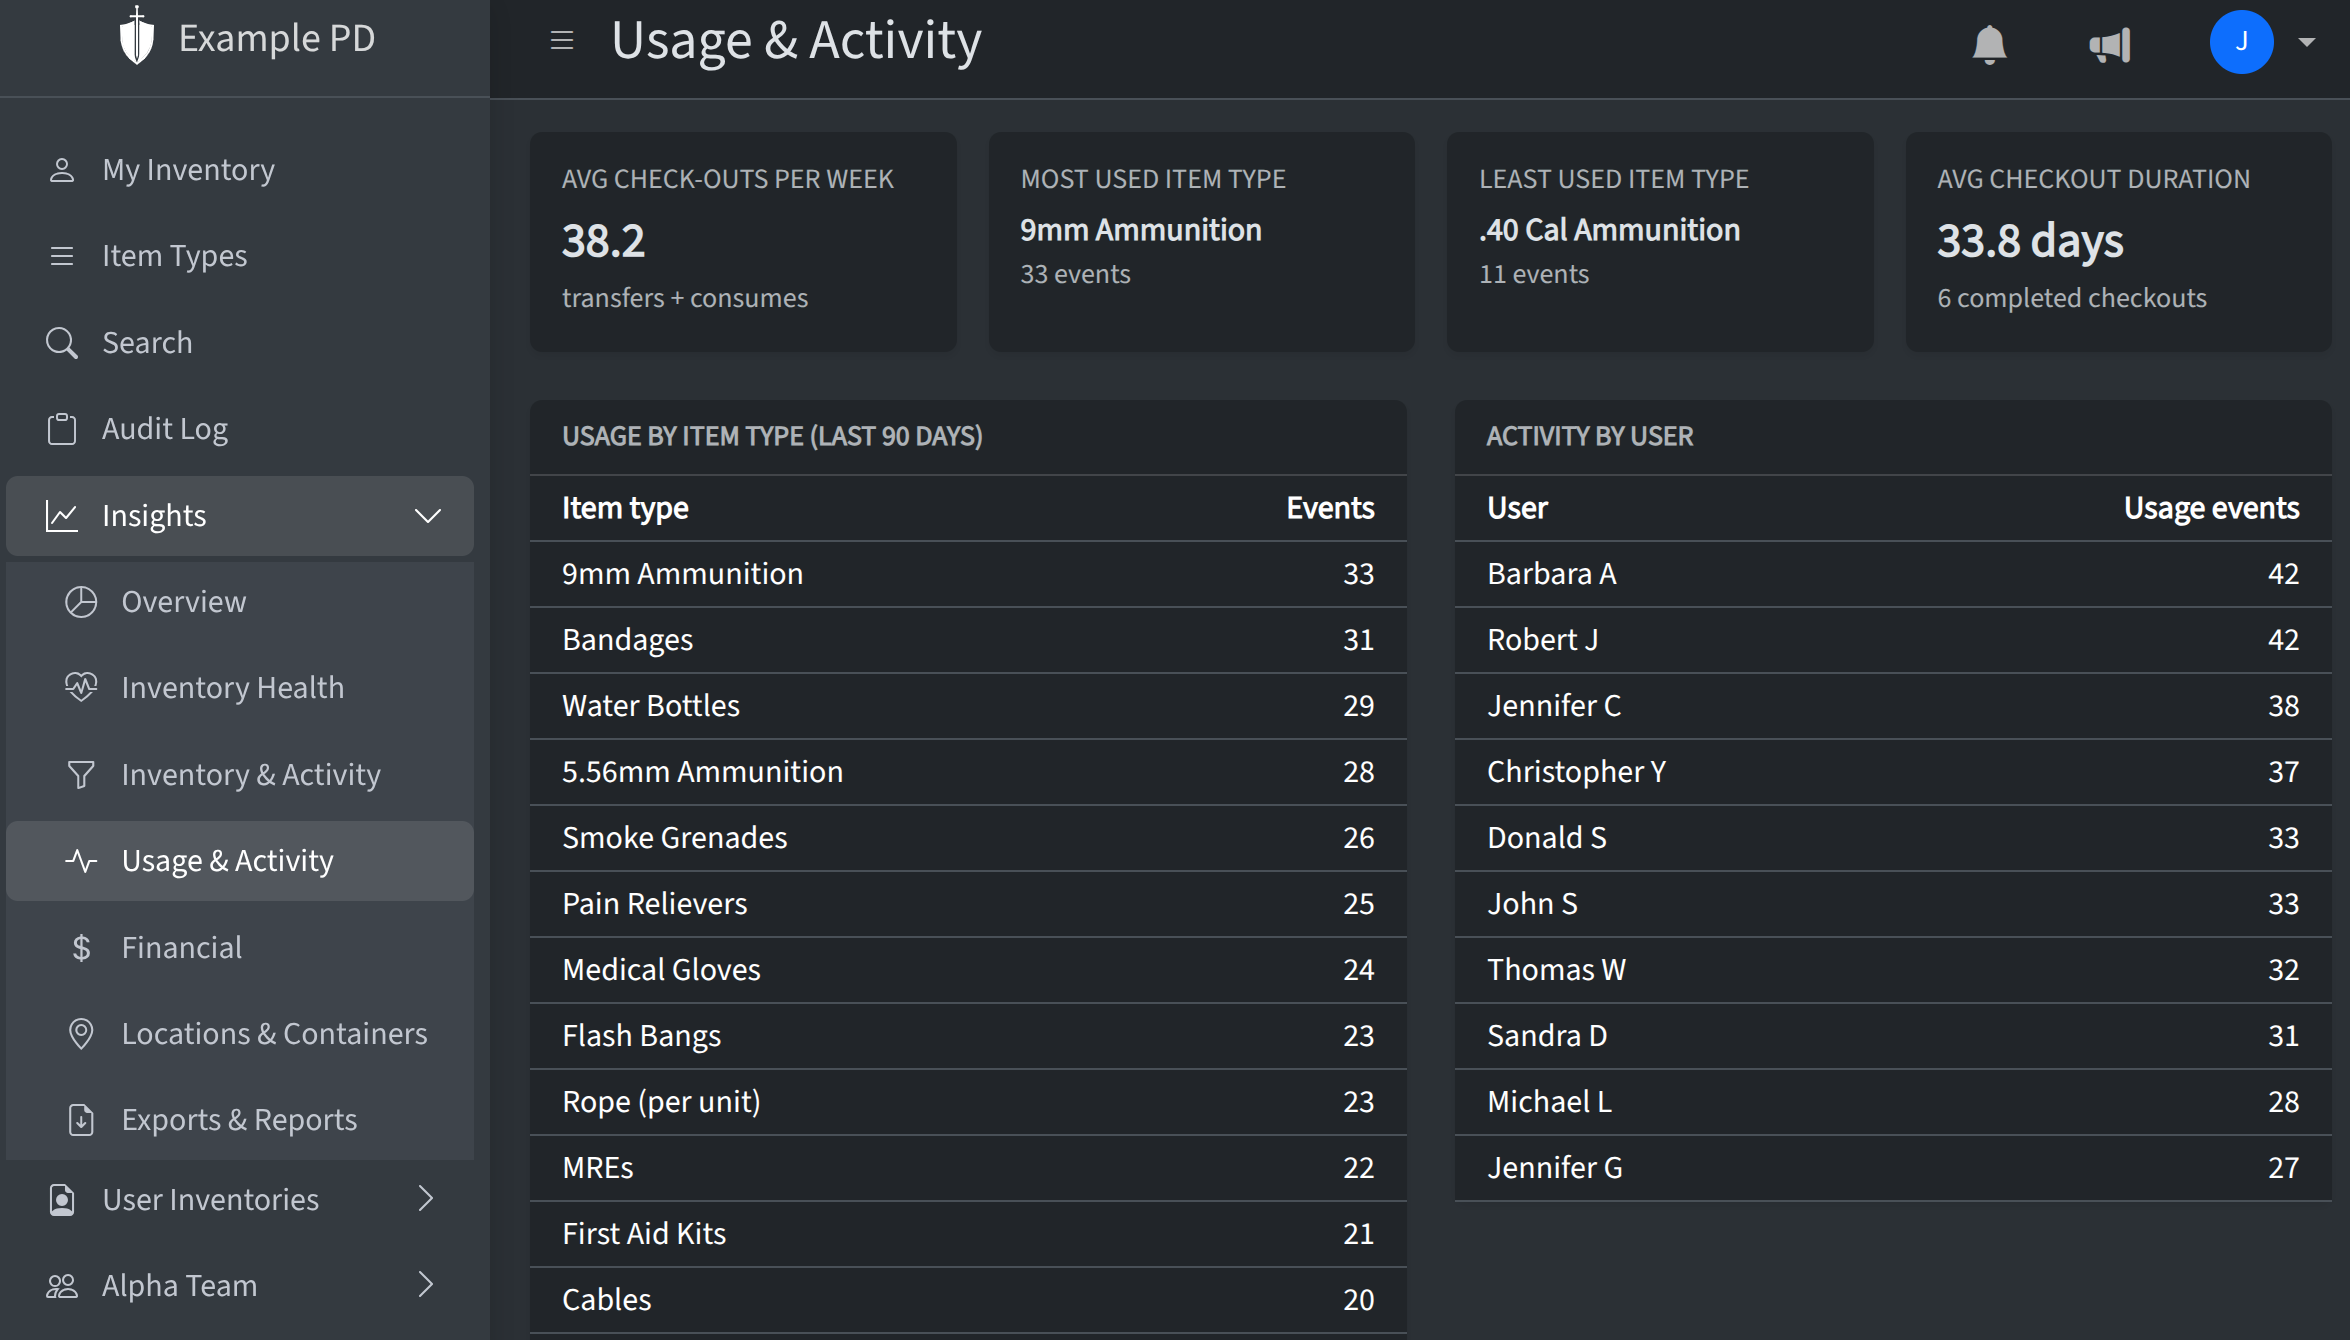
Export (CSV or Excel) reflects the same last 90 days view as the dashboard: summary KPIs, usage by item type, activity by user, and item types with no transfer/consume activity in that window.
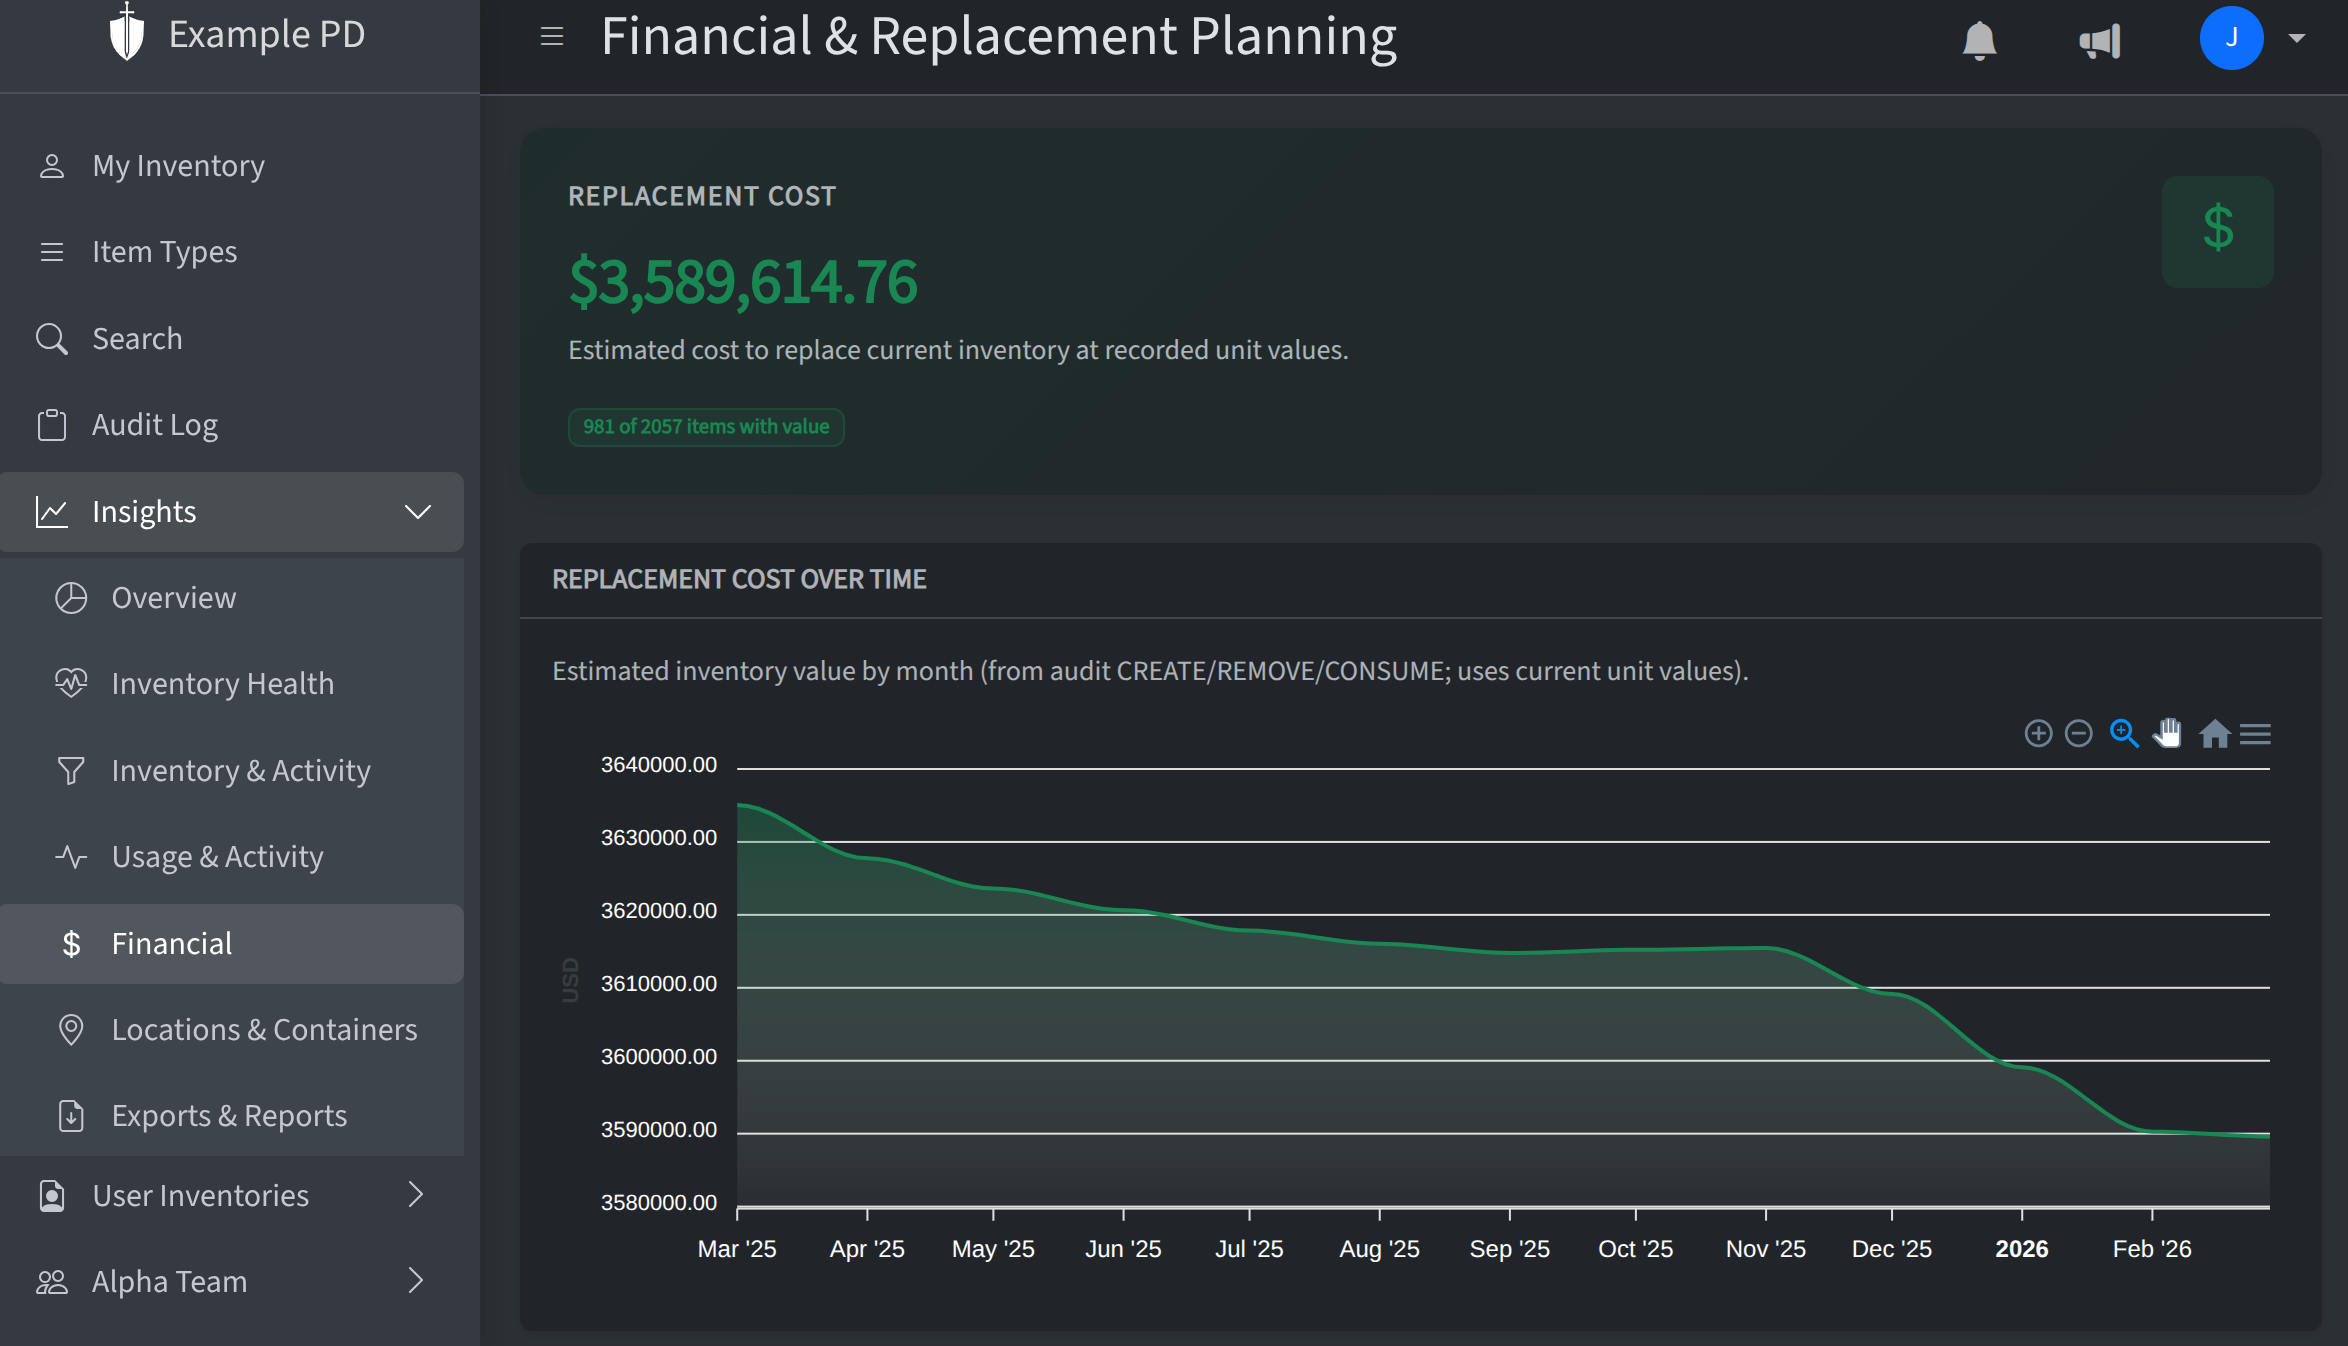
Financial
When your account has Track financial data enabled (in Account settings), Financial appears under Insights. It shows cost and value reports based on unit values set on item types—estimated inventory value over time and related metrics. If the feature is off, this menu item is hidden.
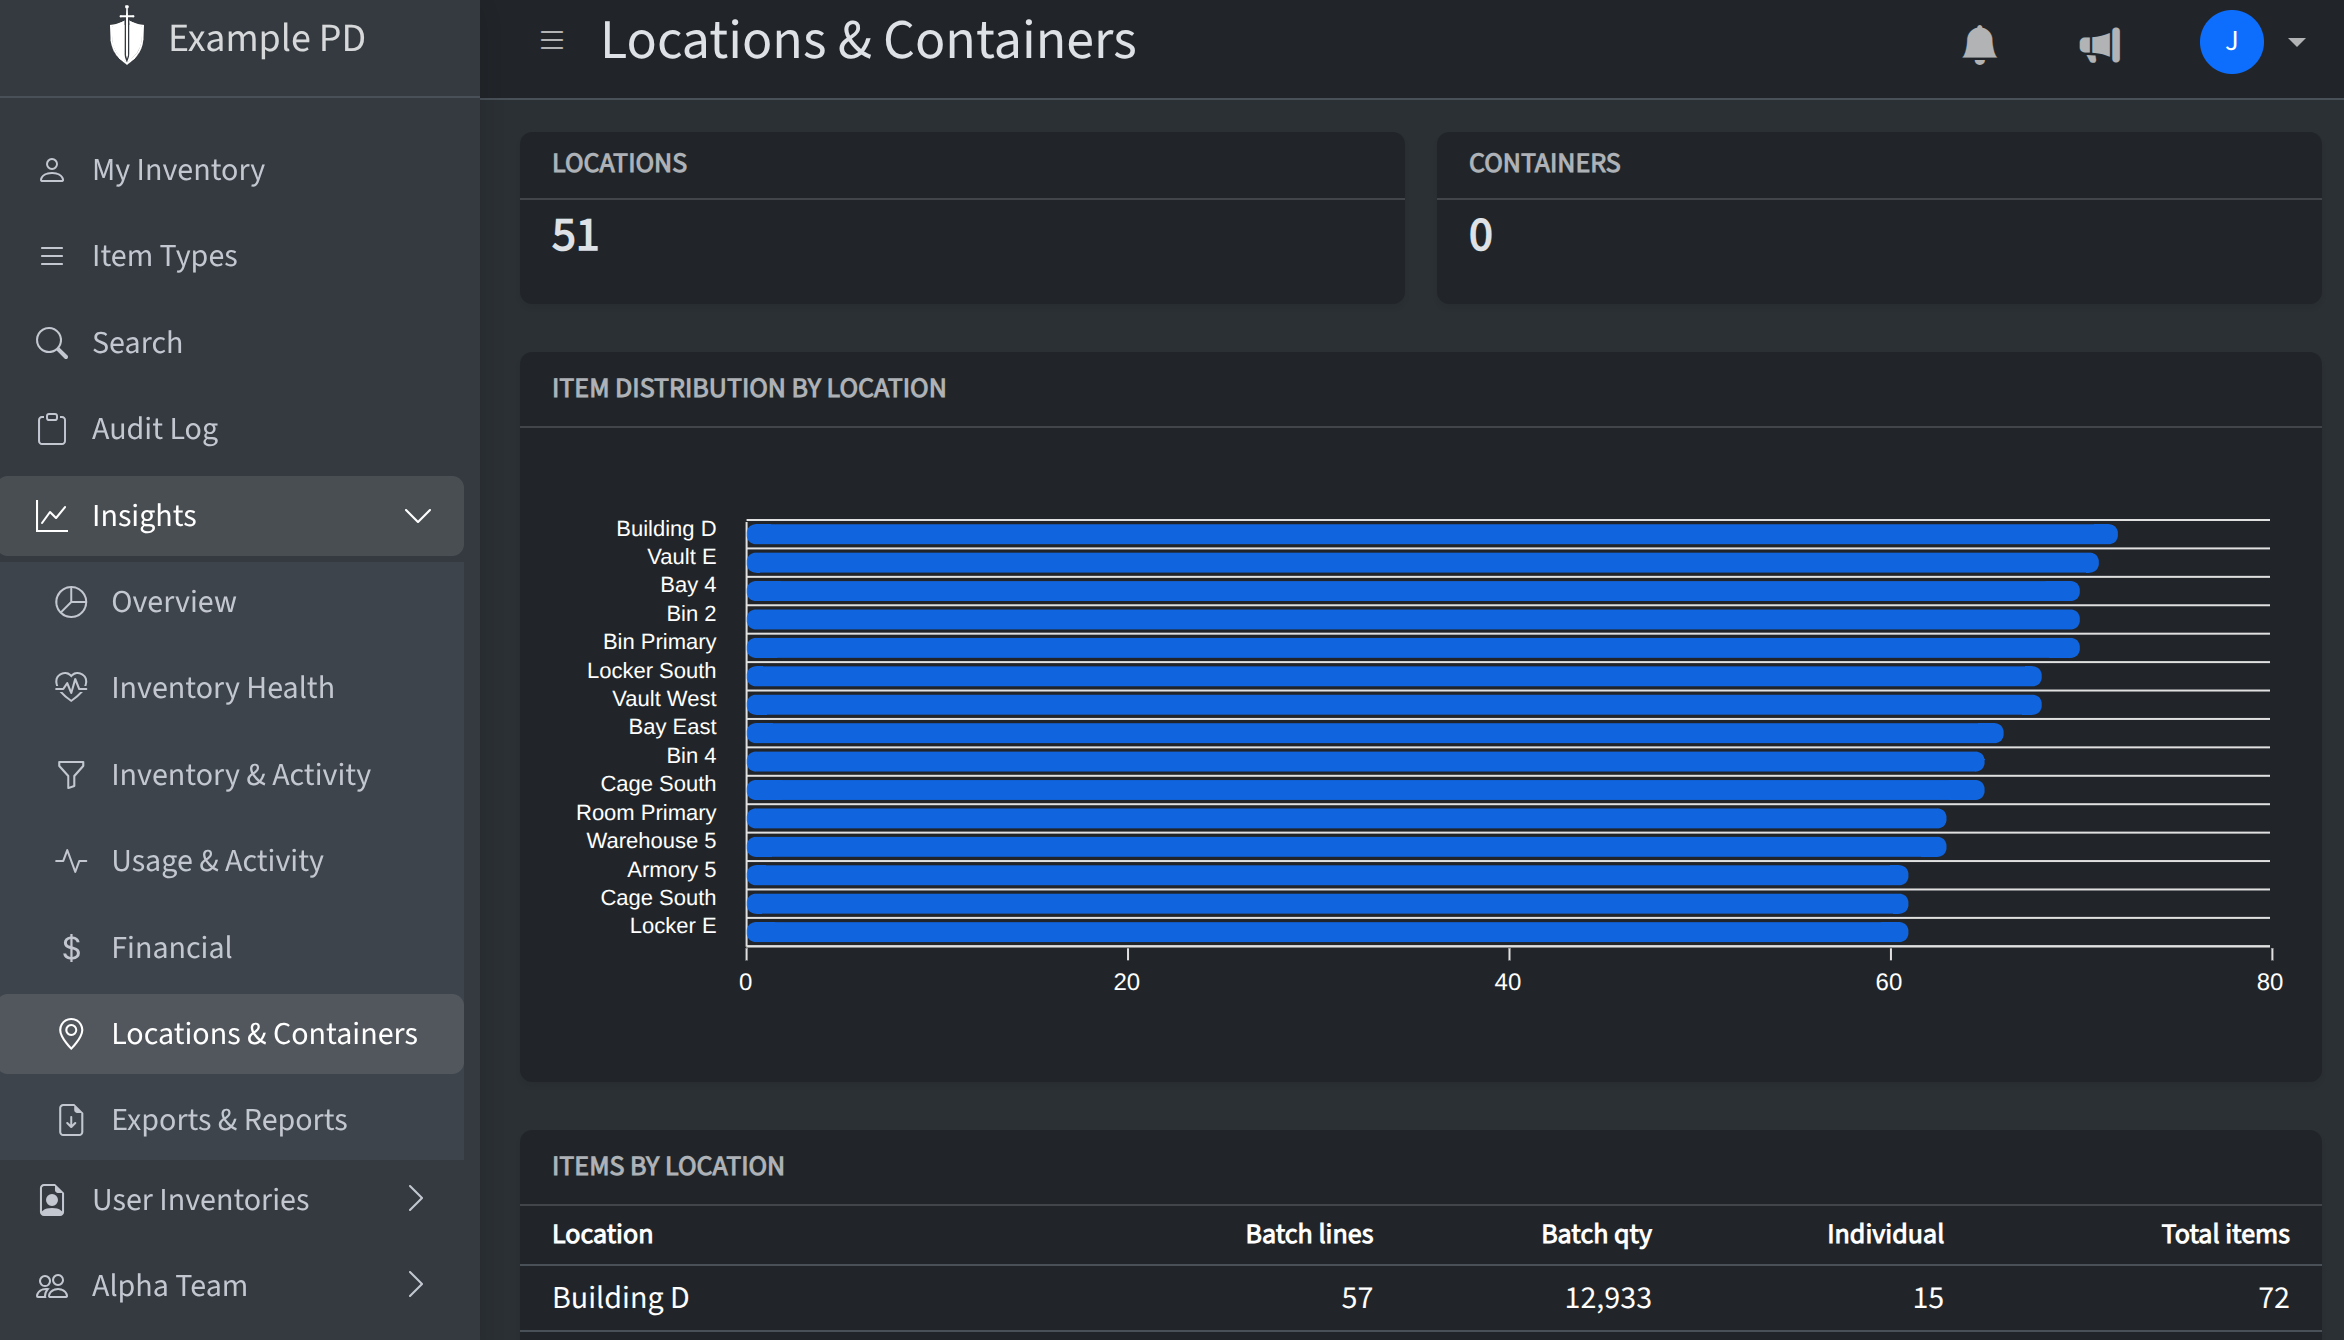
Locations & Containers
This page gives a structural view of your locations and containers: the hierarchy of teams, locations, and boxes/shelves. Use it to see how your physical layout is organized and where inventory lives.